Is Anthropogenic Climate Change Destroying the World?
Nowadays it is hard to escape the constant media bombardment of dire predictions for life on earth if human beings don't radically curtail the use of fossil fuels. 1 These sources claim that the nearly unanimous consensus of the scientific community is that the carbon dioxide (CO2) generated from the use of fossil fuels is destroying the planet and that only immediate and drastic changes to our way of life can save us (i.e., the “Green New Deal”). These dire assessments are said to be based upon “settled science” that is above question, yet hundreds of scientists are on record as skeptical of these claims. 2 Anyone doubting these views is labeled a “science denier.” However, there are many reasons to question all the doom and gloom. Some of these reasons include promises from scripture; problems with the astronomical theory used to explain climate change over deep time (millions and billions of years); failed catastrophic predictions by climate models over the past half century; the frequent lack of correlation between atmospheric carbon dioxide and temperature; the effects of cloud cover on temperature; and failure to fully take into account solar cycles, clouds, decadal cyclical temperature fluctuations, the effect of cosmic rays on temperature, the ability of many species to rapidly adapt to changing environments, and more. In addition, increased carbon dioxide levels are blamed for decreased pH of the oceans, allegedly bringing harm to species dependent on the availability of carbonate (e.g., corals, crabs, etc.) and an alkaline pH. There is much science to suggest that the climatic patterns are cyclical, natural, and independent of human activity. There are also many known benefits to increased levels of carbon dioxide and temperature. 3 ,4
A previous TASC Newsletter article addressed much of the scripture and some of the science relevant to Noah’s Flood and climate change; 5 a brief review of that article will be given here. After the Flood, God promised Noah in Gen 8:22 that the earth would continue to have normal seasonal weather and would continue to produce food until the end of the age when there will be a new heaven and new earth (Rev 20:11, 21:1). God designed the earth to be inhabited and cared for by us (Gen 1:28, Isa 45:18). So, we need not fear that the climate of the earth will be irreversibly harmed by our activities. God built a measure of stability into the climate. Nevertheless, we are called to be good stewards of the creation. This stewardship could include finding alternative/renewable sources of energy, reasonable pollution controls, more efficient engines, reasonable accommodation for other species, etc.
Scientists that believe the earth is billions of years old often subscribe to the astronomical theory of climate change. The theory holds that small variations in the incident sunlight intensity on the earth’s upper atmosphere due to the orbital behavior of the earth over deep time, coupled with multiple feedback mechanisms, determines global temperatures and ice sheet formation (ice ages). The alleged evidence for this theory is the timings of changes in isotope ratios of oxygen (and other elements) in ice cores in Greenland and Antarctica and in deep-sea sediments. These proxies presumably record the temperature and, indirectly, the extent of ice sheet coverage. The variations in isotope ratios are said to be “in tune” with the orbital behavior of the earth. So, assuming constant snowfall and sedimentation rates, scientists believe they have a window into hundreds of millions of years of earth’s climate history. But there are many problems with the astronomical theory, including poorly understood feedback mechanisms, times when the predicted orbital forcing and temperature don’t correlate, times when the carbon dioxide concentration and temperature don’t correlate, conflicts with radiometric dating, the fact that the changes in energy predicted to occur due to orbital forcing are too small to explain the alleged effects on temperature (hence the need to invoke feedback mechanisms that could amplify the effects), and others. Most of the depths of ice cores and sedimentary layers were laid down rapidly during the Flood and not slowly and uniformly as secular scientists suppose. The Flood was uniquely able to bring warm oceans (volcanism from breaking up the fountains of the deep, Gen 7:11) and a cool atmosphere (reflection of sunlight from volcanic particulates) simultaneously facilitating rapid ice sheet formation after the Flood. Only since hundreds of years after the Flood has the rate of deposition of ice in Greenland and Antarctica and sedimentation on the sea floors been uniform over time. With this brief review, let’s look at several reasons why climate change is not primarily due to human activity.
When climate alarmists say we must act now, they are usually basing their urgency on the predictions of climate models. But as shown in Figure 1, climate models have a poor track record and have almost always made incorrect predictions. 6
Image
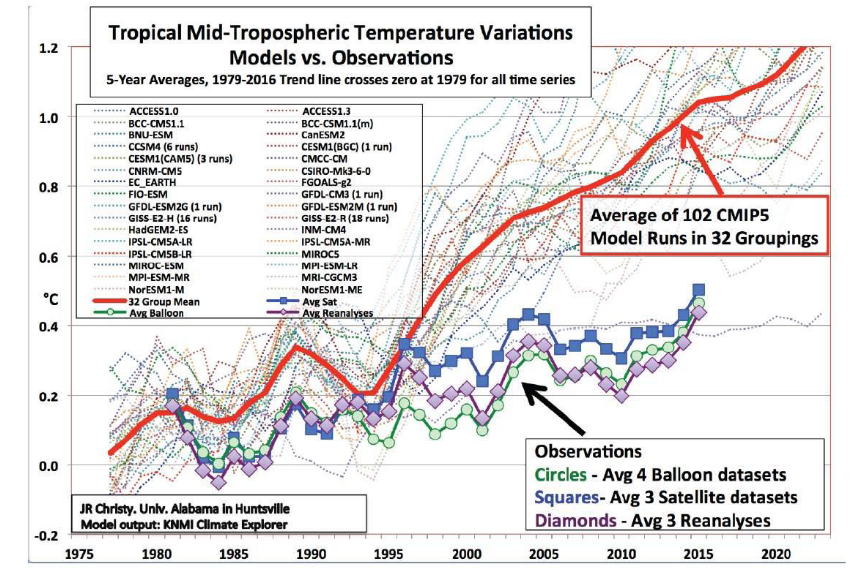
As can be seen in Figure 1, the averaged predicted temperature change (red line) of many models tends to run “hot” and has not matched observations (bottom green, blue, and purple lines). Some of the climate predictions based on these flawed models over the last half century, 7 ,8 ,9 ,10 allegedly attributable to human activity, have been: the coming of a new ice age, 11 rising sea levels that would destroy coastal cities and some island nations, the complete disappearance of arctic ice, widespread famines, massive destruction of ocean life, droughts, the end of snow, mass extinctions, etc. The predictions have almost always been expressed in urgent terms with claims like “we only have 10 years” until catastrophe. But the catastrophes have never materialized! Should we remake civilization based on models with such awful track records? If the models can’t explain the past, should we trust them to accurately predict the future? Surely not! The reality is that our climate is a very complex phenomenon that is still poorly understood. Recently, climate modelers, to their credit, are beginning to take into account the effects of cloud cover on earth’s climate. 1 But the resulting models appear to be even less accurate than previous models, again pointing to the complexities of climate and the unreliability of the models.
The main message coming from climate alarmists is that the CO2 generated by human activity is by far the most important factor determining earth’s climate. However, assuming deep time for the sake of argument, there is often a poor correlation between atmospheric carbon dioxide levels and temperature as shown in Figure 2. 12
Image
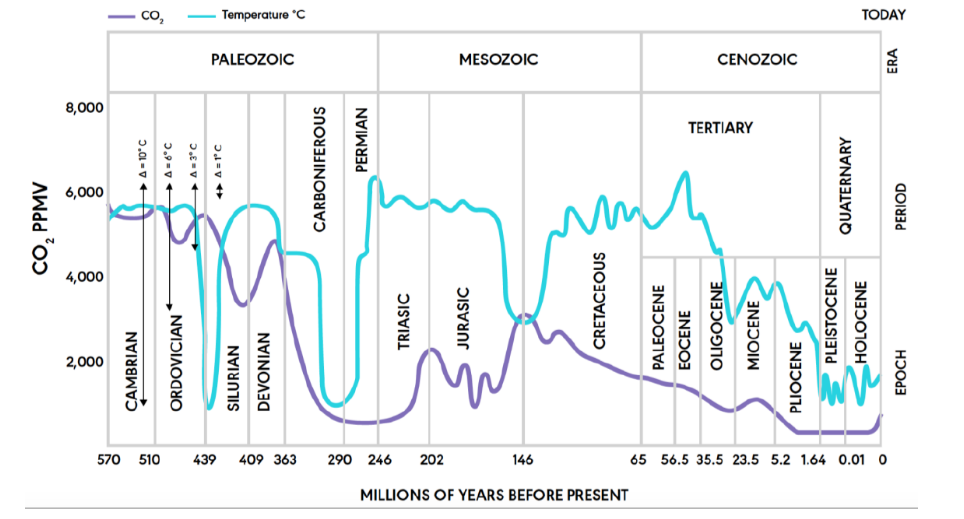
For example, according to Figure 2 13 , the temperature dropped 439 Ma despite an increase in CO2 levels. Afterwards, the temperature rose while CO2 levels dropped (409 Ma). Then during 290–246 Ma, the temperature quickly dropped, then quickly rose all the while CO2 levels remained essentially unchanged. Then from about 170 Ma to 146 Ma, the temperature fell sharply while the CO2 levels increased. The, from about 146 Ma to 160 Ma, the temperature rapidly increased while CO2 levels declined. Finally, from about 160 Ma to 35 Ma, the temperature hovered around a constant average while CO2 levels steadily declined. According to Figure 2, CO2 levels and the temperature have been higher for most of the last 600 Mys than they are now. Hence, according to the science that global alarmists accept, there has been a poor correlation of CO2 levels and temperature over the past 600 Mys, CO2 levels (non-anthropogenic) have been higher in the past, and the temperature has been higher in the past—independent of human activity. Indeed, most multicellular life, including humans, allegedly evolved over the last 600 million years when the CO2 levels and temperatures were higher! By this reckoning then, higher levels of CO2 and higher temperatures are not a threat to life. The temperature maximum seen during the Eocene period (Fig. 1) has been estimated to have been 16°C (28.8°F) warmer than now, yet climate alarmists claim temperature increases of 2 to 3°C would result in irreversible ecological harm. So, if the data show human activity is not required to have higher CO2 levels and temperatures and that life flourished when the earth was warmer than now, why all the urgency and panic? Clearly, for those who ascribe to deep time, there is ample evidence for natural causes of high CO2 levels and high temperatures that operate independently of human activity. There is also good evidence that CO2 is not the main driver of temperature and climate on planet earth, but just one of many variables.
Even during the last 12,000 years (Holocene epoch), there has been no or poor correlation between temperature and CO2 levels. 14
More relevant are the temperatures over the last 2000 years. As shown in Figure 3, the temperatures were warmer than now during the Roman Warm Period (0–150 AD) and the Medieval Warm Period (950–1350 AD). 15
Image
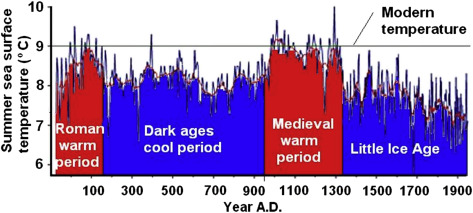
Of course, both time periods were before the industrial age and the widespread use of fossil fuels. These data are credible since the proxies for temperature and dates over this time period are supported by independent observations (human history) and are hence more reliable than those allegedly indicating millions of years. It is also interesting that CO2 levels often lag behind temperature increases, sometimes for thousands of years, 16 ,17 calling into question the role of CO2 in causing temperature increases. When global alarmists say that CO2 levels often track well with temperature, they assume a cause and effect relationship. But correlation does not necessarily indicate causation—there may be other factors involved. It may be that more CO2 is in the air when the temperature rises because CO2 is less soluble in warm water. When the temperature falls, so do atmospheric CO2 levels because CO2 is more soluble in cooler water. Interestingly, water vapor is more abundant in the atmosphere and absorbs and emits more infrared radiation than does CO2, yet is not treated as a greenhouse gas in climate models. 18 The temperature is likely primarily controlled by other factors (see below).
The claim is made that the earth’s climate was stable until the industrial revolution, but modern rates of temperature change per century (as measured in Greenland ice cores) are the same or even less than those over the last 50,000 years. 19
The behavior of the sun is poorly represented in climate models. Most models assume that the sun’s only variation is in its well-known eleven-year sunspot cycle, but there are other cyclical variations. Solar activity is at a maximum when there are the most sunspots. The strength and extent of the sun’s magnetic field is also at a maximum It when the number of sunspots is highest. The sun’s magnetic field helps deflect cosmic rays from the earth’s atmosphere. Cosmic rays are known to seed cloud formation. Clouds are known to cool the earth by reflecting sunlight. One of the cyclical variations in solar activity is known to operate over roughly 1000 years. There are cosmogenic isotopes (radioactive elements that form when cosmic rays interact with elements in the atmosphere or on the ground) that can be used as proxies for cosmic ray flux. There is a good and better correlation between temperature and cosmic ray flux than between temperature and CO2 levels over millennial periods. 14 Other cyclical behavior patterns in temperature occur every 9.1, 10.5, 20, 60, 115, and 2100 to 2500 years. These are attributed to orbital resonances of the solar system. The 9.1-, 10.5-, 20-, and 60-year cycles correspond to various alignments of the sun, moon, Jupiter, and Saturn. 20 It is thought that the 20- and 60-year oscillations can account for 50% of the warming observed between 1970 and 2000. These oscillations cause a natural variability in the temperature that climate models need to take into account.
In one study, a three-frequency sunspot model (9.93, 11.0, and 11.86 years; the 9.93- and 11.96-year frequencies are due to the gravitation influences of Jupiter and Saturn) correlated well with surface temperatures in the Northern hemisphere over the last 2000 years as shown in Figure 4. 21
Image

Temperature measurement problems have also added to inaccuracies. For example, the apparent increase in average temperatures over the last several decades has been partly due to the increased urbanization of temperature sensor sites over time. The result has mainly impacted the daily minimum temperatures. Concrete radiates infrared radiation at night keeping the local temperatures from cooling as fast as they would in a rural environment. This was demonstrated by examining the temperatures of Melbourne and Laverton, a Melbourne suburb with much less urban development, from the early 1940s thru 2015. 22 While the daily maximum temperatures of the two locations differed little over this time period, the daily minima in temperatures varied as much as 2°C, with Melbourne always being warmer. So at least part of the apparent trend in rising temperatures over the last two centuries has been due to urbanization’s impact on temperature measurements, not greenhouse warming. The use of satellites for temperature measurement (ongoing since 1979) does not suffer from these artifacts. Using satellites, the projected rate of global temperature increase (based on observations) is about 1.4°C per century, 23 about half the average rate predicted by climate models.
On the positive side, it well known that increased atmospheric CO2 levels stimulate plant growth. Indeed, doubling the CO2 level has been experimentally demonstrated to increase the growth of a wide variety of plants by as much as 50%. 24 Added benefits for these stimulated plants are increased water use efficiency (making them more resistant to drought), increased soil organic matter, and greater resistance to environmental stressors (soil salinity, temperature, low light intensity, and lower levels of soil fertility). In fact, when the CO2 levels increase, many plants begin to thrive at higher temperatures. Indeed, atmospheric CO 2 acts as an air born fertilizer. Satellite studies have shown that terrestrial plant life productivity has increased by 6 to 13% since the 1980s. Other studies have shown that the net carbon uptake of the biosphere has doubled since the 1980s. There are many other benefits to rising CO 2 levels. 25
Another issue associated with rising CO 2 levels is heating and acidification of the oceans. It is claimed that human activity is threatening several species that rely on calcification. Life such as corals and mollusks (oysters, clams, scallops, and conchs) are in view.
The beautiful corals of the Great Barrier Reef are known to undergo a process called bleaching in which the corals may eventually die. 26 High and low temperatures can cause bleaching.
Corals consist of polyps (a few millimeters across) that live in a symbiotic relationship with algae, the source of color. The photosynthesis of algae provides food and energy for the polyp while the polyp provides algae with a nice place to live. At a high enough temperature, a polyp will expel the symbiont alga because the alga begins to become toxic. Corals lose color and become white (bleached) after the symbiont is expelled. If a polyp does not take in another species of algae, it will die within a few weeks to months. Polyps can take on various species of algae whenever the conditions are right; the algae are freely available in the water.
Some scientists say mass bleaching of the Great Barrier Reef corals has only occurred since the 1970s and is due to anthropogenic CO2 emissions. However, the temperature has not increased by more than 1°C over the last 100 years.
There are two kinds of symbionts: one allows rapid coral growth but is sensitive to temperature; the other facilitates slow coral growth but is more tolerant of high temperatures. The polyps decide which type of symbiont to take in. If the first is chosen and the temperature gets too high, the polyp expels the symbiont and risks bleaching. On the other hand, if the polyp chooses the second type and the temperature remains cool, faster growing polyps will out compete the slower growing ones. Reefs usually have both types of polyps with the result that if bleaching occurs, the survivors will reestablish the corals within a few years. 27
Bleaching is a defense mechanism that allows polyps to change symbionts in response to stress. 28 Most bleached corals fully recover. Bleaching is not new and was first reported back in 1930. Most of the corals that are susceptible to bleaching are relatively short lived. 29 Other longer living corals are less susceptible.
There is growing evidence that corals can adapt to increasing temperatures in only a few years. 30 Corals are resilient and apparently readily adapt to changing temperatures. 31 Overall, corals grow faster when the temperature is higher. 31 There is evidence that the main impact of temperature on coral bleaching is the rate of temperature change and not the absolute temperature. 32 Other documented causes of coral bleaching include solar irradiance, solar irradiance combined with higher temperature, changes in salinity, bacterial infections, and toxicants. 33
The other detrimental impact increased atmospheric CO2 is predicted to have on calcification of corals is related to the pH of sea water. When CO2 dissolves in water, it reacts with water to form carbonic acid (H2CO3). Carbonic acid can dissociate to a proton and bicarbonate ion (HCO3). Bicarbonate, in turn, can lose a proton to become carbonate (CO3-2). The released protons will cause the pH of the water to decrease. These reactions are in equilibrium and reversible. Corals build their skeletons out of calcium carbonate (CaCO3). As the pH drops, less carbonate will be dissolved in the water. It is believed that this decrease in carbonate will give corals less raw materials with which to build their skeletons. The normal pH of sea water is above 8. A prolonged exposure of corals to pH 7.5 is considered harmful.
The calcification rate of corals can be measured because corals produce a new layer of CaCO3 each year. A study of coral calcification rate examined corals that were believed to be hundreds of years old. The study concluded that the calcification rate has dropped precipitously (15%) since 1990. However, other researchers found the study was flawed. In the original study, two sets of corals were compared. The first set were large corals and were examined in the 1980s. The second set were smaller and younger corals and were examined in the early 2000s. But instrument errors were found in the second set of measurements. Also, an age effect on calcification rate was not taken into account in the original study. When these errors were corrected, there was no change in calcification rate over time. 34 ,35
A different study of growth rates of corals in the offshore and mid-shelf reefs (99% of the Great Barrier Reef is located there) since the 1940s determined there had been a 10% increase in calcification rates. However, inshore reefs have shown a 5% decline in calcification rates. 36
Studies have shown that calcification rates for the dominant species of coral in the Caribbean increase with the temperature. 37
Presumably, human activity has caused the pH of the oceans to drop by 0.1. However, there is much natural variability in ocean pH. During the day when photosynthesis is in full swing, CO 2 is removed from the water and atmosphere by photosynthesis, causing the pH to rise. At night, however, animals continue to respire while photosynthesis ceases causing an increase in the CO2 in the atmosphere and water, causing the pH to drop. One example of an isolated coral reef pool has shown daily pH changes in the range of 7.5 to 9.4! Another study in the Great Barrier Reef has shown variability of pH between 8.0 and 8.4 in the summer. So, corals are exposed to variable pH daily.
Testing near Hawaii has shown a decline in the average pH since 1988.
It has been established that the amount of a boron isotope incorporated into coral can serve as a proxy for pH. When this proxy was used to evaluate pH over many years at various locations, a natural variability in the average pH was found. For example, a study at Flinders Reef (Great Barrier Reef) showed the average pH had randomly varied between 7.9 and 8.2 over the last three hundred years. 38 A similar variation range (7.9–8.3) has also been reported for the average pH in the South China Sea over the last several thousand years. In these examples, rapid pH changes occurred well before the Industrial Revolution and the rate of change was sometimes faster than what has been observed in the last few decades. Corals are well adapted to changing pH as they are exposed to it daily.
Most lab experiments aimed at understanding the effect of pH on calcification rates of corals have looked at the effects of different constant pH levels but as we have seen, the pH varies cyclically daily in the wild. Another experimental approach has been to use the native environment to test the effects of acidification due to CO2 in partially open containers. This type of experiment was carried out on Porites corals from Heron Island off the Australian coast. The 6-month study was carried out from mid-winter to early summer. These corals maintained their calcifying fluid pH levels despite variable external temperatures and pH. This implies that corals have a high tolerance for varying pH. 39 There have been modest declines in calcification rates for some corals in some localities (e.g., 3.3% decline for Porites from mid-shelf central Great Barrier Reef). 40 However, it is sometimes unclear if the decline in calcification rate is due to loss of solubility of carbonate as the temperature increases or is due to pH drop. 40 Many laboratory experiments on various species of corals have shown that they are able to acclimate, adapt, and even flourish in lower pH environments. 41
The effect of pH drop on mollusks (oysters, clams, scallops, and conchs) appears to be mixed. 42 ,43 These animals usually build their shells more slowly as the CO2 concentration rises, but not always. Some crabs and lobsters show an increase in calcification rate. 42
One recent study of the effects of pH on blue king crabs found that although growth rates slowed and mortality rates increased when the pH was dropped to 7.5, the species quickly adapted with growth and mortality rates returning to normal within a few months. This “phenotypic plasticity” is expected to help these crabs adapt to more realistic and gradual pH changes going forward. 44
A recent study on the calcification of foraminifera showed that levels of carbonate inside the cytoplasm of cells was maintained the same over a broad range of external pH by the pumping of protons out of the cell. In other words, organisms that calcify are equipped to generate the CaCO3 they need independent of external pH. 45
In general, it has been found that “multiple studies from multiple ocean regions confirm ocean productivity tends to increase with temperature. Subjects of this research include phytoplankton and macroalgae, corals, crustaceans, and fish.” 31
In summary, predicted eco-catastrophes are based on climate models with poor track records; they almost always get it wrong. 46
These models do not adequately take into account the impact of clouds, the true variability of solar irradiance, or cosmic rays. According to the climate history that climate alarmists respect, there has been a poor correlation between CO2 levels and temperature over the last 600 million years. The temperatures and CO2 levels were usually greater before the Industrial Revolution. Much science shows that higher CO2 levels are beneficial to much of the biosphere. The temperatures we observe now are within the natural variability observed before the Industrial Revolution. Climate science still has a long way to go before it should be trusted with our economic and political well-being. God designed our planet to be inhabited and cared for by us. It was no doubt designed to remain stable to various environmental changes. May the Lord help us to be good stewards of His creation without being afraid to use it for our benefit.
- 1 a b For example, see Bender M (2020 Jan 29) Climate change predictions have suddenly gone catastrophic. This is why. https://www.vice.com/en_us/article/9393jd/climate-change-predictions-have-suddenly-gone-catastrophic-this-is-why Accessed 2020 Apr 16
- 2For example, see The Nongovernmental International Panel on Climate Change (NIPCC) (2019) Climate Change Reconsidered II: Fossil Fuels http://climatechangereconsidered.org Accessed 2020 Apr 16 Note: The NIPCC is a group of scientists skeptical of anthropogenic climate change.
- 3Idso CD, Moore P (2019) Environmental benefits. Climate Change Reconsidered II: Fossil Fuels. Nongovernmental International Panel on Climate Change (NIPCC). Arlington Heights, IL, The Heartland Institute, 2019. http://climatechangereconsidered.org/wp-content/uploads/2018/12/5-Environmental-Benefits-final.pdf Accessed 2020 Apr 16.
- 4Ridd P (2017) The extraordinary resilience of Great Barrier Reef corals, and problems with policy science. Climate Change: The Facts 2017, ed. J Marohasy (Melbourne, Institute of Public Affairs) 13
- 5Reynolds DW (2016 Jan) The ice age, climate change, and creation. TASC Newsletter. https://tasc-creationscience.org/article/ice-age-climate-change-and-creation Accessed 2020 Apr 16
- 6Data by John R. Christy, University of Alabama in Huntsville. See https://www.heartland.org/Center-Climate-Environment/index.html Accessed 2020 Apr 16
- 750 years of failed apocalyptic predictions (2019 Dec 03) https://dwahts.blogspot.com/2019/12/50-years-of-failed-apocalyptic.html Accessed 2020 Apr 16
- 8Svab P (2019 Sep 25) Dozens of failed climate predictions stretch 80 years back http://theepochtimes.com/dozens-of-failed-climate-predictions-stretch-80-years-back_3096733.html Accessed 2020 Apr 16
- 930 years of failed climate predictions (2018 Jun 24) https://dwahts.blogspot.com/2018/06/30-years-of-failed-climate-predictions.html?m=1 Accessed 2020 Apr 16
- 10Ebell M, Milloy SJ (2019 Sep 18) Wrong again: 50 years of failed eco-pocalyptic predictions https://cei.org/blog/wrong-again-50-years-failed-eco-pocalyptic-predictions Accessed 2020 Apr 16
- 11Richard K (2016 Sep 13) Massive cover-up exposed: 285 papers from 1960s-’80s reveal robust global cooling scientific ‘consensus’ http://notrickszone.com/2016/09/13/massive-cover-up-exposed-285-papers-from-1960s-80s-reveal-robust-global-cooling-scientific-consensus/#sthash. Y0AQQJii.I3TmtpHM.dpbs Accessed 2020 Apr 16
- 12Idso CD, Legates D, Singer SF (2019) Climate science. Climate Change Reconsidered II: Fossil Fuels. Nongovernmental International Panel on Climate Change (NIPCC), Arlington Heights, The Heartland Institute, 135, Figure 2.1.2.3.1 http://climatechangereconsidered.org/wp-content/uploads/2018/12/2-Climate-Science-final.pdf Accessed 2020 Apr 16.
- 13Idso CD, Legates D, Singer SF (2019) Climate science. Climate Change Reconsidered II: Fossil Fuels. Nongovernmental International Panel on Climate Change (NIPCC), Arlington Heights, The Heartland Institute, 135, Figure 2.1.2.3.1 http://climatechangereconsidered.org/wp-content/uploads/2018/12/2-Climate-Science-final.pdf Accessed 2020 Apr 16.
- 14 a b Scafetta N (2017) Understanding climate change in terms of natural variability. Climate Change: The Facts 2017, ed. J Marohasy (Melbourne, Institute of Public Affairs) 44
- 15Idso CD, Moore P (2019) 138, Figure 2.1.2.3.3
- 16Idso CD, Moore P (2019) 138
- 17Plimer I (2017) Carbon dioxide and the evolution of the earth’s atmosphere. Climate Change: The Facts 2017, ed. J Marohasy (Melbourne, Institute of Public Affairs) 303
- 18Abbot J, Nicol J (2017) The contribution of carbon dioxide to global warming. Climate Change: The Facts 2017, ed. J Marohasy (Melbourne, Institute of Public Affairs) 288
- 19Carter B (2017) The geological context of natural climate change. Climate Change: The Facts 2017, ed. J Marohasy (Melbourne, Institute of Public Affairs) 313
- 20Scafetta N (2017) 50
- 21Scafetta N (2012) Multi-scale harmonic model for solar and climate cyclical variation throughout the Holocene based on Jupiter-Saturn tidal frequencies plus the 11-year solar dynamo cycle. J Atmospheric and Solar-Terrestrial Physics 80:296–311. doi:10.1016/j.jastp.2012.02.016 https://arxiv.org/pdf/1203.4143.pdf Accessed 2020 Apr 16
- 22Quirk T (2017) Taking Melbourne’s temperature. Climate Change: The Facts 2017, ed. J Marohasy (Melbourne, Institute of Public Affairs) 110
- 23Spencer RW (2017) The advantages of satellite-based regional and global temperature monitoring. Climate Change: The Facts 2017, ed. J Marohasy (Melbourne, Institute of Public Affairs) 181
- 24Idso CJ (2017) Carbon dioxide and plant growth. Climate Change: The Facts 2017, ed. J Marohasy (Melbourne, Institute of Public Affairs)
- 25Idso CD, Legates D, Singer SF (2019) 249
- 26Ridd P (2017) 9
- 27Ibid., 12
- 28Ibid., 13
- 29Ibid., 15
- 30Idso CD, Moore P (2019) 525.
- 31 a b c Idso CD, Idso SB, Carter RM, Singer SF (2014) Aquatic life. Climate Change Reconsidered II: Biological Impacts, eds. DC Bast, ST Karnick (Chicago, IL, The Heartland Institute) 743 https://www.heartland.org/_template-assets/documents/CCR/CCR-IIb/Chapter-6-Aquatic-Life.pdf Accessed 2019 Apr 16
- 32Ibid., 757
- 33Ibid., 758
- 34Ridd P (2017) 17
- 35Ridd PV, da Silva ET, Stieglitz T (2013) Have coral calcification rates slowed in the last twenty years? Marine Geology 346:392–9
- 36Ridd P (2017) 18
- 37Idso CD, Legates D, Singer SF (2019) 251
- 38Abbot J, Morohasy J (2017) Ocean acidification: Not yet a catastrophe for the Great Barrier Reef, Climate Change: The Facts 2017, ed. J Marohasy (Melbourne, Institute of Public Affairs) 29–30
- 39Ibid., 34
- 40 a b Ibid., 35
- 41Idso CD, Idso SB, Carter RM, Singer SF (2014) 876ff
- 42 a b Abbot J, Morohasy J (2017) 36
- 43Idso CD, Idso SB, Carter RM, Singer SF (2014) Section 6.3.3.1
- 44Long WC, Van Sant SB, Swiney KM, Foy RJ (2017) Survival, growth, and morphology of blue king crabs: Effect of ocean acidification decreases with exposure time. ICES J Marine Science 74(4):1033–41. doi:10.1093/icesjms/fsw197
- 45Toyofuku T, Matsuo MY, de Nooijer LJ, Nagai Y, Kawada S, Fujita K, Reichart G-J, Nomaki H, et al. (2017) Proton pumping accompanies calcification in foraminifera. Nature Communications 8(14145) doi:10.1038/ncomms14145 https://www.nature.com/articles/ncomms14145 Accessed 2020 Apr 16
- 46Here are some very good websites on climate change: https://www.c3headlines.com/temperature-charts-historical-proxies.html ; https://notrickszone.com/ ; https://realclimatescience.com/ ; https://cei.org/issues/climate ; https://www.youtube.com/watch?v=vwUhJaQVi-M&feature=youtu.be